Task-oriented data classification and design of choropleth maps (aChor)
Maps were always an important tool for citizens and experts, due to growing data volumes and various spatial problems their relevance is even increasing nowadays. Now at the Lab for Geoinformatics and Geovisualization (g2lab) of the HafenCity University Hamburg (Germany) a new project starts that aims at the creation of more expressive and informative maps.
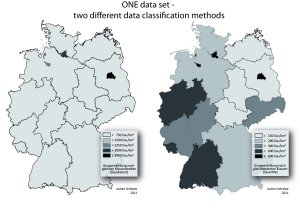
In thematic maps, i.e. for representing population density, the values of single regions (like states) are often categorized into classes and colored uniquely in order to obtain a better overview. For this data categorization a variety of methods is available that, however, can lead to very different visualizations, and with that to different interpretation and decisions.
Furthermore these methods work data-driven and do not consider a possible spatial context. If, for example, a state that contains a local outlier value is put into the same category as some of the neighboring regions, this important information gets lost. Instead of the data-driven approach the project aChor now pursues the reverse way: Firstly, spatial “tasks” like the preservation of local outliers are specified. For this – but also for the preservation of large value difference, Hot Spots or so-called clusters – new algorithms will be developed, implemented and tested. In addition, research will be undertaken in order to “translate” value differences between categories into corresponding color differences for the actual map visualization so that users can achieve a fast and correct cognition.
| QGIS PlugIn for an aChor data classification that preserves polygons with local extreme values (on GitHub) Explanations for the QGIS PlugIn |
Funding is provided by the German Research Foundation (DFG).