Combining data of different spatial granularity (CoGran)
Data journalism often deals with statistical data which has a spatial reference and is, after applying suitable analysis operations, finally presented in form of maps. This data is attached to specific reporting zones which can have a quite different spatial granularity. For example, in Berlin there are 12 boroughs (“Bezirke“), 96 districts (“Ortsteile“), 190 postal code areas, 447 “Lebensweltlich orientierte Räume” (“Kieze“), 1790 poll sites, and more than 16.000 building blocks.
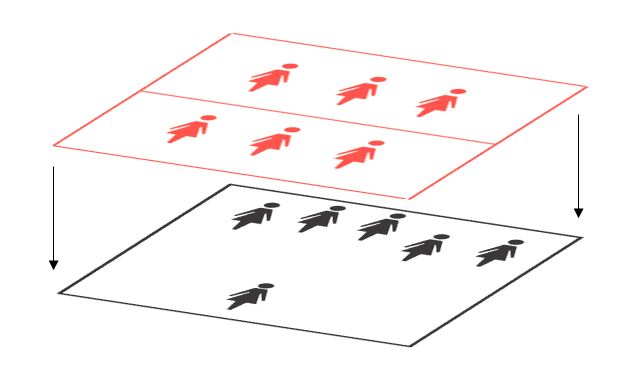
For specific purposes – like for a legible overview map – it becomes necessary to combine data to larger spatial units (e.g., from “Kiez” level to borough level). A spatial re‐organization of data also becomes necessary by merging multiple data sets which might produce new insights, stories, and finally maps. However, these data sets are very often attached to different reporting zones. Just to mention one example: Crime statistics are spatially less detailed than data of the register of residents, and those numbers again are less detailed than election data. For practical use in the domain of data journalism there is a lack of scientifically grounded recommendations or even workflows for suitable re‐organization methods.
The practical goal is the development of an interactive, free and open source software tool for general usage and further development.
Funding is provided by VolkswagenStiftung. More information on this project can be found on the website of VolkswagenStiftung.
Responsible researchers
and Julius Tröger (Berliner Morgenpost)