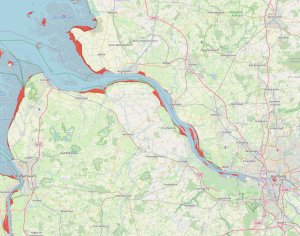
Sea Level Map
A team of g2lab scientists visualized the scientific results for sea level rise using an interactive web map. The map depicts various climate scenarios of the Intergovernmental Panel on Climate Change and shows, in addition to the flooded area, the number of people affected in northern Germany. The simulation shows various scenarios of the predicted sea level rise for the year 2100. This enables a low-threshold overview of the risks and effects of climate change-related sea level rise.
This is the link to the Sea Level Map.
For more information see also our papers in KN - Journal of Cartography and Geogrphic Information or Hydrographische Nachrichten.